
Capsifi — Value Stream Experience
SaaS B2B Platform — Transforming a Static Enterprise Architecture Tool into an Interactive Modelling Experience

Redesigned Capsifi’s Value Stream module to transform a static, read-only architecture view into an interactive, decision-support tool. By introducing contextual editing, scalable bulk actions, and clearer hierarchy, the experience reduced modelling friction and improved clarity for enterprise architects operating in complex data environments.
Contest
Capsifi is an enterprise business architecture platform used by large organisations to model capabilities, value streams, and strategic initiatives.
Users — typically business architects and transformation leads — relied on the Value Stream module to understand operational maturity, capability gaps, and cross-functional dependencies.
However, the interface was largely static and view-only. Editing capability instances required navigating away from context into dense forms, creating friction and cognitive overload.
This limited usability, slowed modelling workflows, and reduced adoption among non-technical stakeholders.
Problem
The existing experience had three core issues:
Static, read-only interface
Users could view capability relationships but not meaningfully interact with them in context.High cognitive load
Dense information, unclear hierarchy, and lack of structured interaction made it difficult to focus on what mattered.Disconnected editing workflow
Updating capability data required leaving the map view, breaking context and slowing decision-making.
As a result:
Users relied on external analysis tools.
Editing related capabilities was repetitive and inefficient.
Adoption across transformation teams was limited.

Capsifi 1.5 (Legacy Experience – Before Redesign)
The value stream was view-only and cluttered with low-signal information. Users had no ability to edit in context, and the visual density reduced clarity, making it difficult to understand ownership, progress, or next steps..
“At first glance, it’s overwhelming and hard to navigate to the real issue. As architects, we need a broad view of the map—and then the ability to drill into details to understand what’s going wrong.”
Hypothesis
If we shift from a static, view-only interface to an interactive modelling experience with contextual editing and scalable workflows, users will:
Complete modelling tasks more efficiently
Reduce repetitive updates
Gain clearer insight into capability relationships
Improve confidence when presenting to stakeholders
My Role
As the sole UX/Product Designer, I:
Led end-to-end UX strategy and execution
Conducted workflow analysis and stakeholder reviews
Facilitated design trade-off discussions with engineering
Designed interaction patterns and system behaviours
Balanced usability improvements with architectural constraints
Approach
I conducted:
Stakeholder interviews with business architects
Workflow mapping of modelling tasks
Usability reviews of existing flows
Constraint sessions with engineering
Key insight:
Users didn’t struggle with the concept of value streams — they struggled with how the system forced them to interact with the data.

Design Exploration

Early Direction — Direct Map Editing
The initial concept allowed users to add and edit capability instances directly on the value stream map using drag-and-drop interactions.
This would have created a highly interactive modelling experience.
However, after reviewing with engineering, we identified that this approach required a significant architectural overhaul and exceeded delivery constraints.

Option 1 — Inline Selection via Dropdown
Users can select a capability instance from a structured dropdown within context.
This approach:
Reduced implementation complexity
Maintained data relationships
Allowed structured control over capability mapping

Option 2 — Guided Selection with Controlled Editing
Users can pick and assign capability instances through a contextual panel.
This solution:
Provides flexibility without breaking architecture
Enables editing without leaving the page
Balances usability improvements with technical feasibility
Design Trade-offs — Final Solution

1.Contextual Editing on the Map
In the final design, hovering over a connection (arrow) on the value stream map reveals an edit icon.
Clicking the icon opens a contextual fly-out, allowing users to view and update capability instance details directly within the map view, without losing spatial context.
This preserves flow while avoiding disruptive navigation.

2. Lightweight Fly-out Panel (Architecture-Safe)
Instead of rebuilding the map interaction model, editing is handled through a structured fly-out panel.
This approach:
Maintains system architecture integrity
Minimises engineering complexity
Enables structured data updates within context
It delivers usability improvements without requiring backend redesign.

3. Bulk Selection for Efficiency
Users can now select and update multiple capability instances at once, instead of editing each individually.
This significantly reduces repetitive actions and improves efficiency for enterprise users managing large data sets.
Bulk interaction transformed a previously manual process into a scalable workflow.
User’s preferred version of comparison

User testing revealed that stakeholders preferred separate tables for each time dimension, making it easier to focus on specific time-based data without cognitive overload.
To support deeper analysis, the final tab enables side-by-side comparison across time periods, helping users identify patterns, performance shifts, and change over time.
We also introduced:
Toggle controls to turn heatmaps on or off, allowing users to switch between raw data and visual insights.
First- and second-level relationship views, enabling users to drill into connected capabilities and explore dependencies in “deep mode.”
This structure balanced clarity with analytical power — supporting both quick scanning and detailed investigation.
Design Trade-off — Phase 1 Release

Initial Constraint-Based Solution
For the first release, full cross-table comparison was not technically feasible within the delivery timeline.
To ship value quickly, we enabled comparison directly within the data table using visual heatmaps and structured columns.
While not the long-term ideal, this approach allowed users to:
Compare performance indicators side by side
Identify patterns using color-based signals
Maintain workflow continuity without navigating away
This ensured we delivered immediate analytical value without delaying release.

Enhanced Filtering via Side Panel
To improve usability within this constraint, we introduced a contextual side panel for advanced filtering.
Users can now:
Filter by assessor, region, time dimension, and deployment
Narrow large datasets quickly
Focus on relevant slices of data before comparing
This improved clarity and reduced cognitive load when working with high-density enterprise data.
Old vs New — Editing Business Capabilities

Version 2.0 — Inline Editing (Legacy)
Editing capability instances required interacting directly within a dense form layout.
Key limitations included:
Limited visibility of related data
Minimal guidance or system feedback
Constrained scalability for multi-item updates
High cognitive load when managing complex capability relationships
The experience was functional but rigid, making bulk updates inefficient.

Version 2.1 — Structured Fly-out Workflow
The redesigned fly-out introduces a clearer, task-focused editing experience.
Improvements include:
Clear separation of time dimension and capability selection
Bulk generation and editing of capability instances
Contextual data preview within the same view
Better system feedback and structured hierarchy
This update reduces friction, improves scalability, and supports enterprise-level data management without overwhelming users.
Outcome

This redesign transformed the Value Stream module from a static reference interface into an interactive modelling environment.
Post-release feedback indicated:
Improved clarity during enterprise transformation workshops
Reduced friction when updating multiple capability instances
Lower reliance on external tools for comparative analysis
Increased confidence in presenting capability maturity data to stakeholders
By aligning the interface with users’ mental models and introducing scalable interaction patterns, the solution improved both usability and strategic decision support.
Reflection
This project reinforced that enterprise UX is less about surface polish and more about structural alignment.
Key learnings:
Interaction models must reflect user mental models.
Architectural constraints require pragmatic trade-offs.
Incremental improvements can meaningfully increase adoption.
Bulk interaction patterns are critical in data-dense systems.
If revisiting this project, I would explore deeper in-map editing interactions in partnership with engineering to support a more fluid modelling experience in future iterations.
Next Case Study
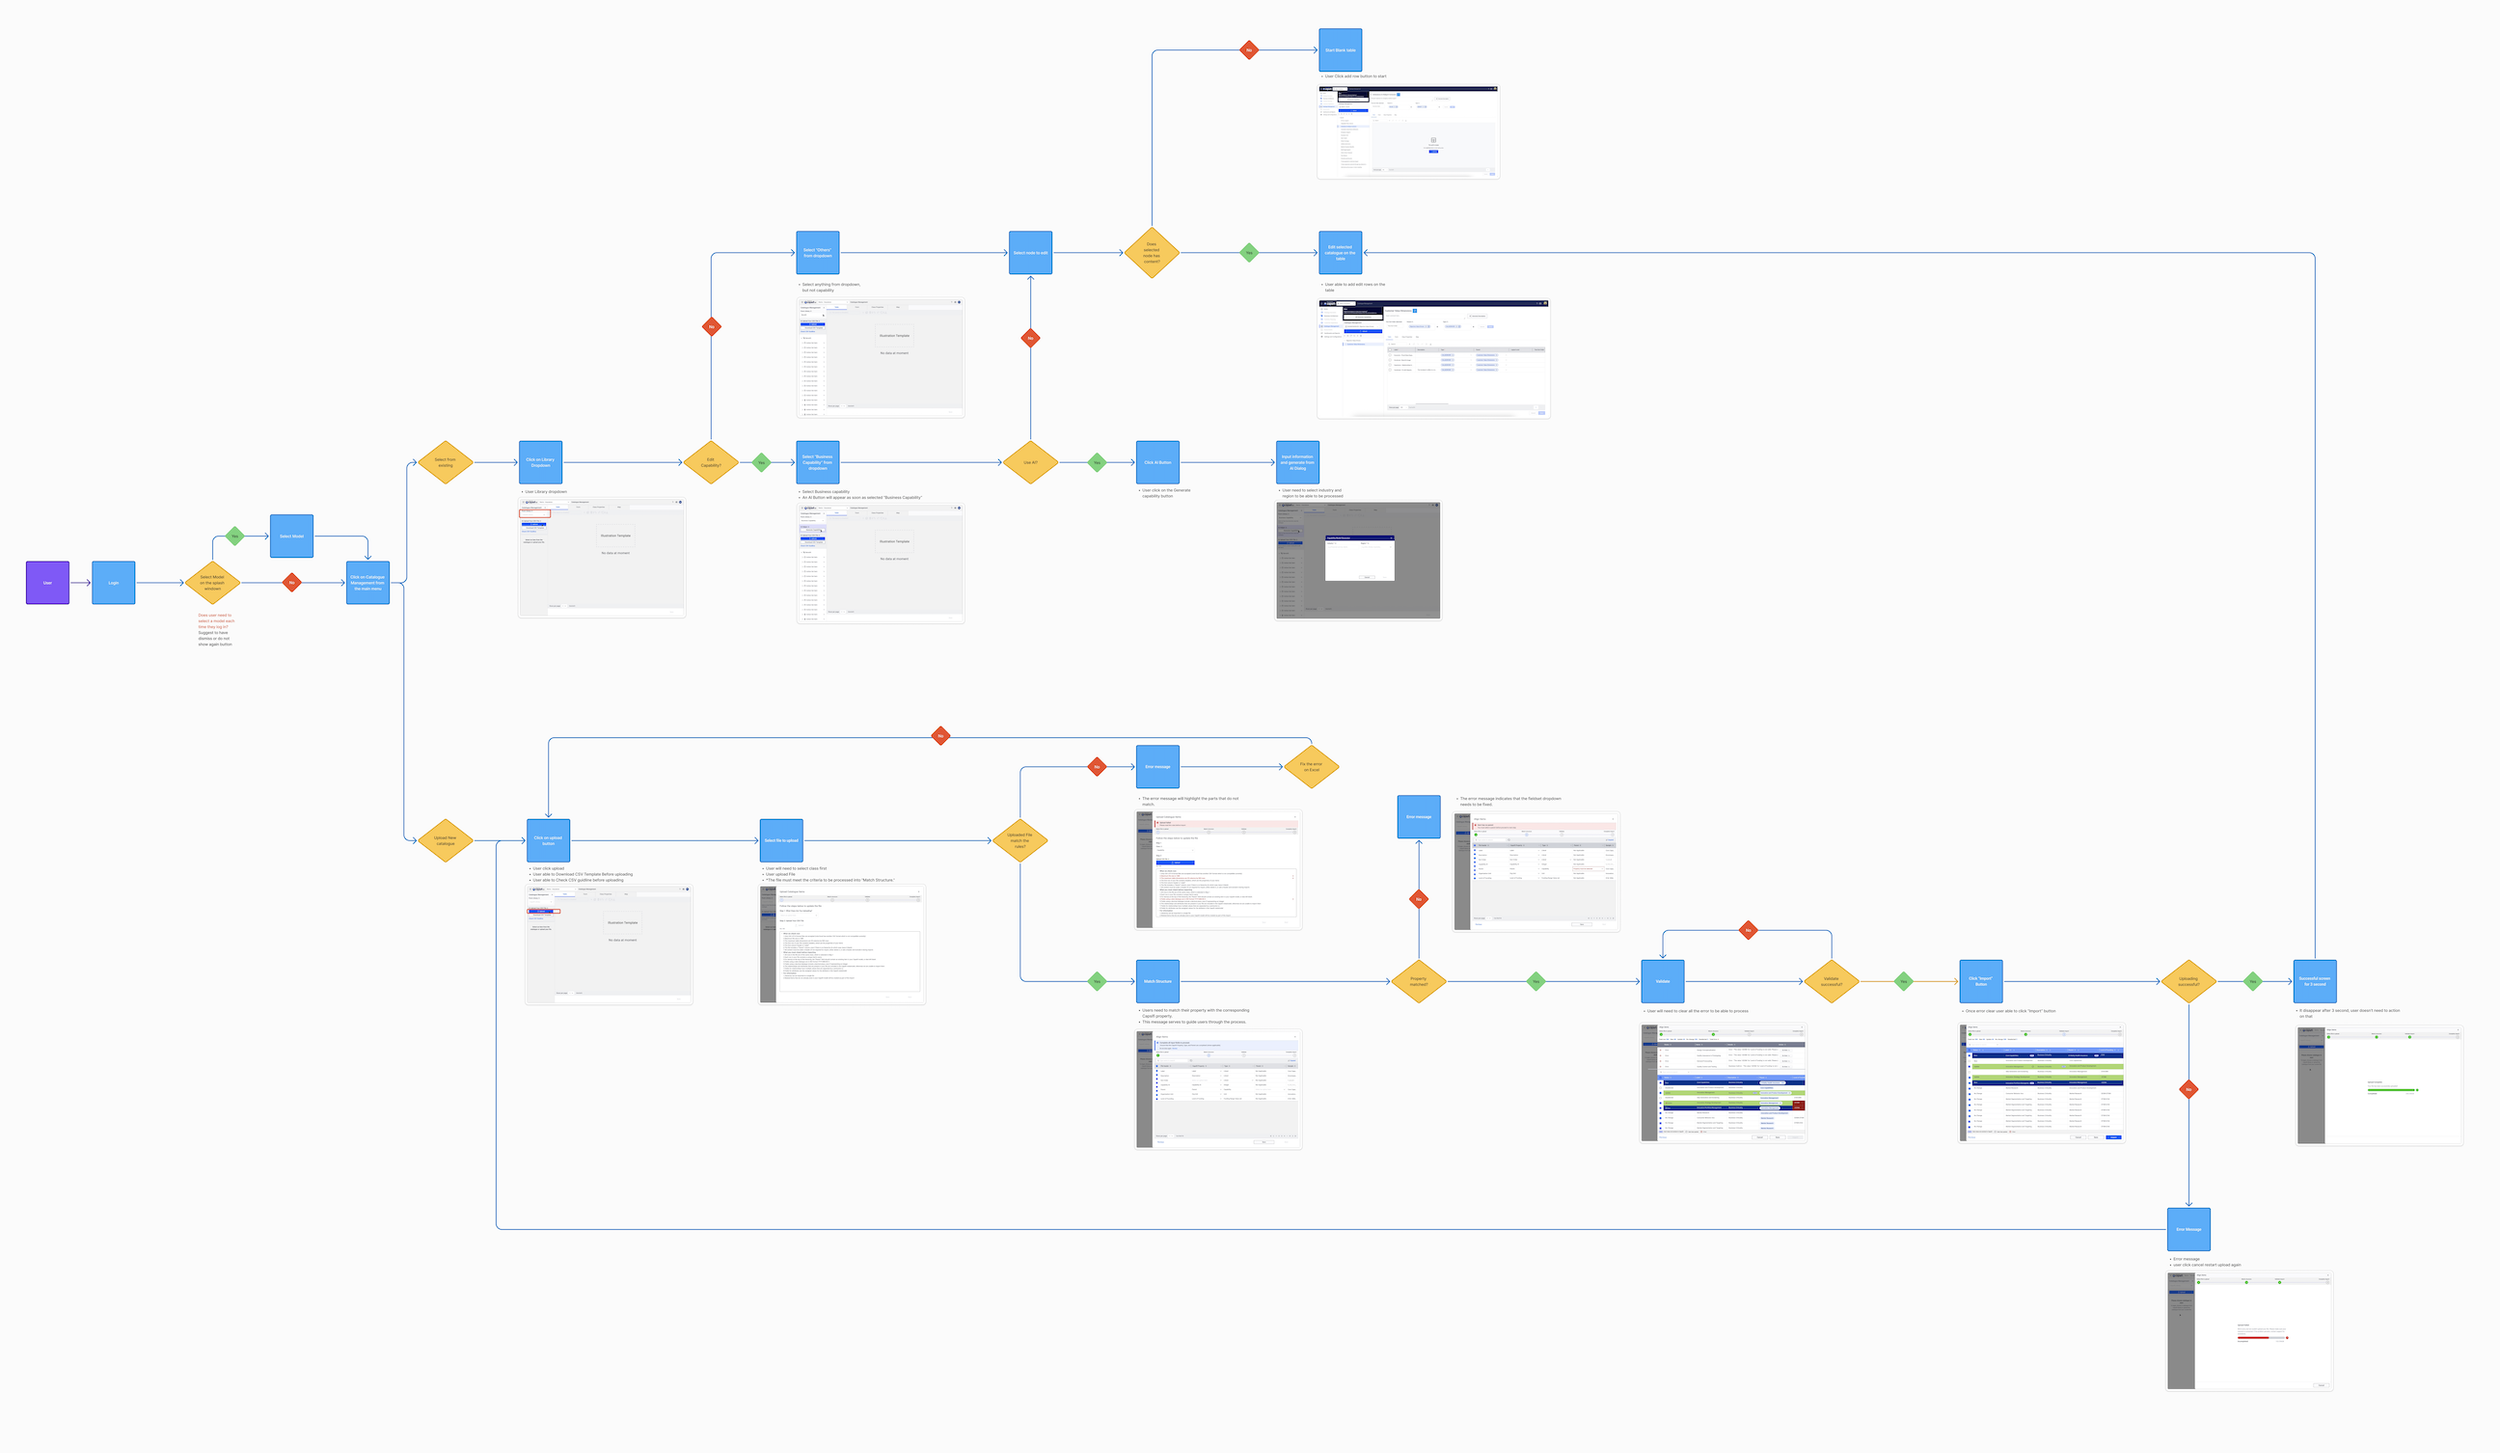
AI Upload Workflow Redesign
This case study examines the redesigned CSV upload process in an enterprise AI platform to minimise user errors, enhance guidance, and foster trust in AI-driven insights.